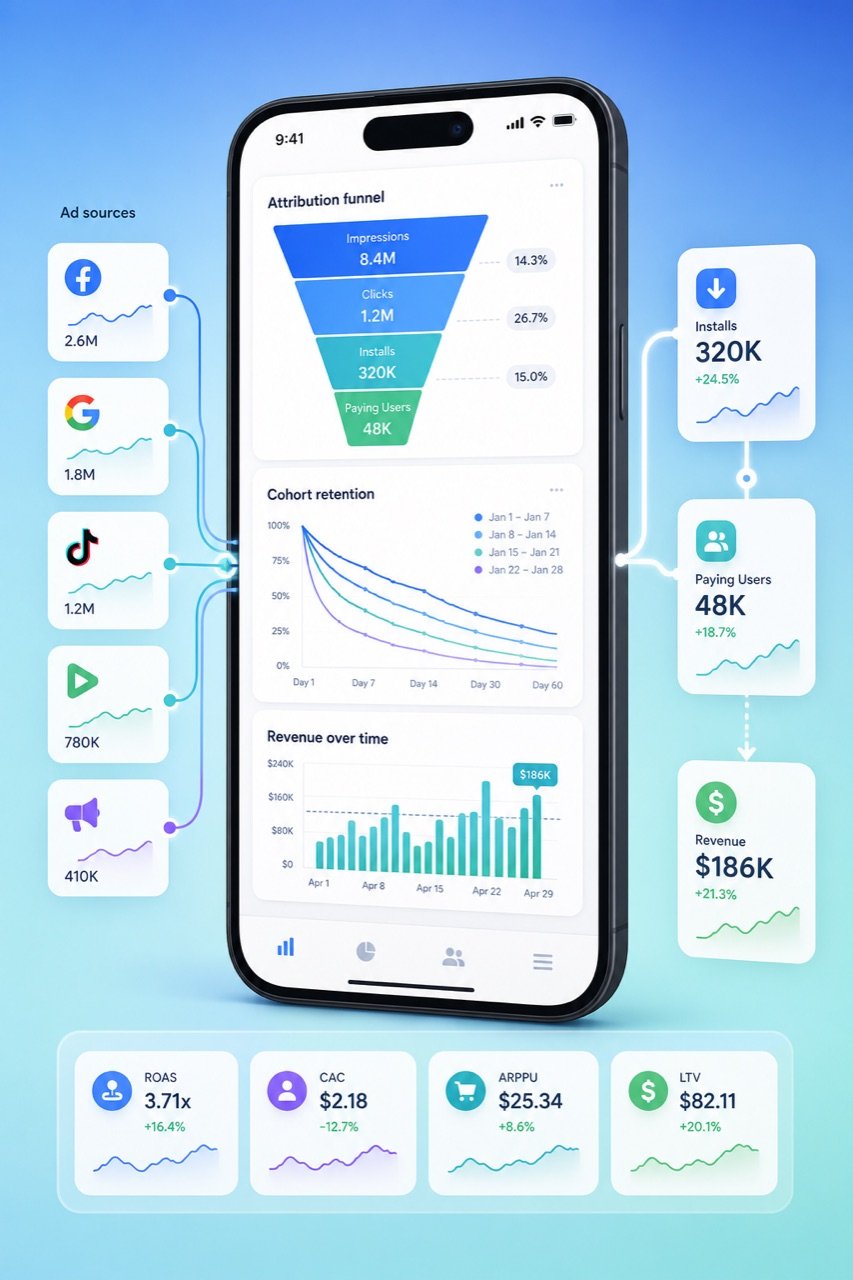
Mobile Attribution Analytics in 2026: 8 Metrics That Actually Drive Decisions

Most mobile teams have attribution tracking wired up — an SDK fires, installs get stamped with a source — and then stop there. Mobile attribution analytics is the layer above tracking: turning that raw install data into metrics you can actually make budget decisions with. The difference matters. Tracking tells you where an install came from; analytics tells you whether that source is worth paying for again. This guide covers the eight metrics that separate reporting from decision-making, how to structure a dashboard around them, and the analysis traps that quietly waste ad spend.
What mobile attribution analytics actually means
Attribution tracking is the plumbing: a click on a Meta or TikTok ad, a deferred deep link, an SDK install event, and a matching algorithm (deterministic ID match or probabilistic modeling) that assigns credit. Tools like AppsFlyer, Adjust, Branch, and Kochava handle this layer, and we compare them in our Best Mobile Attribution Software in 2026 roundup.
Analytics is what you do with the output. It is the discipline of aggregating install-level records into cohorts, ratios, and trends that answer real questions: Which campaign has the best 30-day return? Is this channel's cheap installs actually a fraud pocket? Where does the funnel leak between install and first purchase? If tracking is the sensor, analytics is the decision. For the mechanics of how the underlying attribution works, see our Mobile Ad Attribution 2026 guide.
The 8 mobile attribution analytics metrics that drive decisions
Skip vanity totals. These are the metrics that change what you fund tomorrow.
1. Cost per install (CPI) — but segmented, never blended
A single blended CPI hides everything useful. The number that matters is CPI by source, campaign, and creative, trended week over week. A rising CPI on one channel while others hold flat is your earliest signal of creative fatigue or auction pressure — long before ROAS moves.
2. Install-to-action rate
The share of installs that complete a meaningful event — registration, first session depth, add-to-cart, purchase. A channel with a low CPI but a 2% install-to-action rate is almost always worse than a pricier channel converting at 12%. This ratio is where cheap-install channels expose themselves.
3. ROAS by source and cohort day
Return on ad spend read at fixed cohort ages (D7, D30, D90), not lifetime-to-date. Lifetime ROAS flatters old cohorts and penalizes new ones, making fresh campaigns look weaker than they are. Always compare campaigns at the same cohort age.
4. Retention cohorts (D1 / D7 / D30)
Retention curves per acquisition source are the truest quality signal a paid channel gives you. Two sources with identical CPI and identical install-to-action can have wildly different D30 retention — and the one that retains is the one that compounds. Read retention as a curve, not a single day.
5. LTV:CAC ratio
Predicted lifetime value against fully loaded customer acquisition cost. A healthy paid channel trends toward 3:1 or better as cohorts mature. Below 1:1 you are buying installs that never repay the ad spend, no matter how good the CPI looks. Model LTV from early cohort behavior rather than waiting 90 days to learn a channel was unprofitable.
6. Invalid-traffic / fraud rate
The percentage of installs flagged as invalid traffic (IVT) — click flooding, install hijacking, SDK spoofing, bot farms. A source with suspiciously low CPI and near-zero retention is the classic fraud fingerprint. Watching IVT rate per source, not just in aggregate, keeps a single dirty channel from poisoning your blended numbers.
7. Click-to-install time (attribution latency)
The distribution of time between ad click and install. A source dominated by sub-10-second click-to-install times often signals click injection rather than genuine intent. This distribution is a fraud and quality tell that pure conversion counts hide.
8. Incrementality / lift
The hardest and most honest metric: how many of a channel's attributed installs would have happened anyway. Geo holdout tests and lift studies separate installs a channel caused from installs it merely last-touched. Last-click attribution systematically over-credits retargeting and branded search; incrementality is the correction.
Building a mobile attribution analytics dashboard
A decision-grade dashboard organizes these metrics into three layers:
- Spend efficiency (top): CPI by source, install-to-action rate, and IVT rate — your daily health check for wasted budget.
- Return (middle): ROAS and LTV:CAC at fixed cohort ages, with new versus maturing cohorts side by side.
- Quality (bottom): retention curves and click-to-install distributions per source — the signals that explain why the return numbers move.
Feed all three from the same attribution source of truth so definitions never drift between reports, and default every view to cohort-aged comparisons rather than lifetime-to-date. For a deeper build on the underlying data pipeline, see our Mobile Traffic Attribution 2026 marketer's guide.
Common mobile attribution analytics mistakes
- Trusting last-click alone. Last-touch models over-credit the final channel and hide assist paths. Pair last-click with at least one incrementality read before reallocating budget.
- Comparing cohorts of different ages. A D90 cohort will always out-ROAS a D7 cohort. Comparing them is how good new campaigns get killed early.
- Ignoring the iOS SKAN blind spot. SKAdNetwork returns delayed, aggregated, privacy-thresholded data. Reading it like deterministic attribution produces confidently wrong conclusions — treat SKAN and deterministic data as separate lenses.
- Optimizing to installs instead of downstream value. The cheapest install is rarely the most valuable user. Always carry the funnel through to install-to-action and LTV.
- Blending fraud into the average. One IVT-heavy source can lift blended CPI-efficiency while destroying real return. Always segment.
Post-click: where analytics meets optimization
Attribution analytics tells you which sources deserve more budget — but the return on that budget is set after the click, on the landing experience and the re-engagement flow. That is the post-click layer, and it is where DeepClick focuses: matching the post-click destination to the traffic source and recovering users who install but stall. If your analytics keep surfacing high-CPI sources with weak install-to-action rates, the fix is often post-click, not more spend — see how the tooling stacks up in 5 Best Post-Click Optimization Tools for 2026, and how re-engagement lifts the retention cohorts from metric #4.
FAQ
What is the difference between mobile attribution and mobile attribution analytics? Attribution assigns credit for an install to a source. Analytics aggregates those attributed installs into cohorts, ratios, and trends — CPI, ROAS, retention, LTV:CAC — so you can decide which sources to fund. Attribution is the input; analytics is the decision.
Which mobile attribution analytics metric matters most? No single metric — but if forced to pick one pairing, LTV:CAC read at a fixed cohort age plus retention curves per source will catch most bad channels. CPI alone is the metric most likely to mislead.
How does iOS SKAdNetwork affect attribution analytics? SKAN delivers delayed, aggregated, privacy-thresholded conversion data, so install-level cohort analysis is limited on iOS. Analyze SKAN campaigns with their own conversion-value schema and never merge SKAN numbers directly into deterministic dashboards.
Can attribution analytics detect ad fraud? Yes — segmented IVT rate, abnormally short click-to-install times, and near-zero retention on a low-CPI source are the standard analytical fingerprints of install fraud.
